I’ve listened to Steve Kirsch speak about statistics before. He’s very intelligent. Not too many people could look at the data as he did here and reach such stupid conclusions. It takes work and thought. Kirsch has to work to say things to protect the lie of the fake virus, and this is about as bad as any crap you’d ever hear from Anthony Fauci. So what is Kirsch saying now?
Well, he says that a variant of the fake virus is now reducing MIS-C, Multisystem Inflammatory Syndrome.
C’s Newsletter is a reader-supported publication. To receive new posts and support my work, consider becoming a free or paid subscriber.
So let’s take a look at this latest round of horse manure from Kirsch. I’ve read his article a few times, thinking that it might be satire. I don’t think it is, so I’m taking it at face value. He says that the BA.2 variant increased immunity to MIS-C.
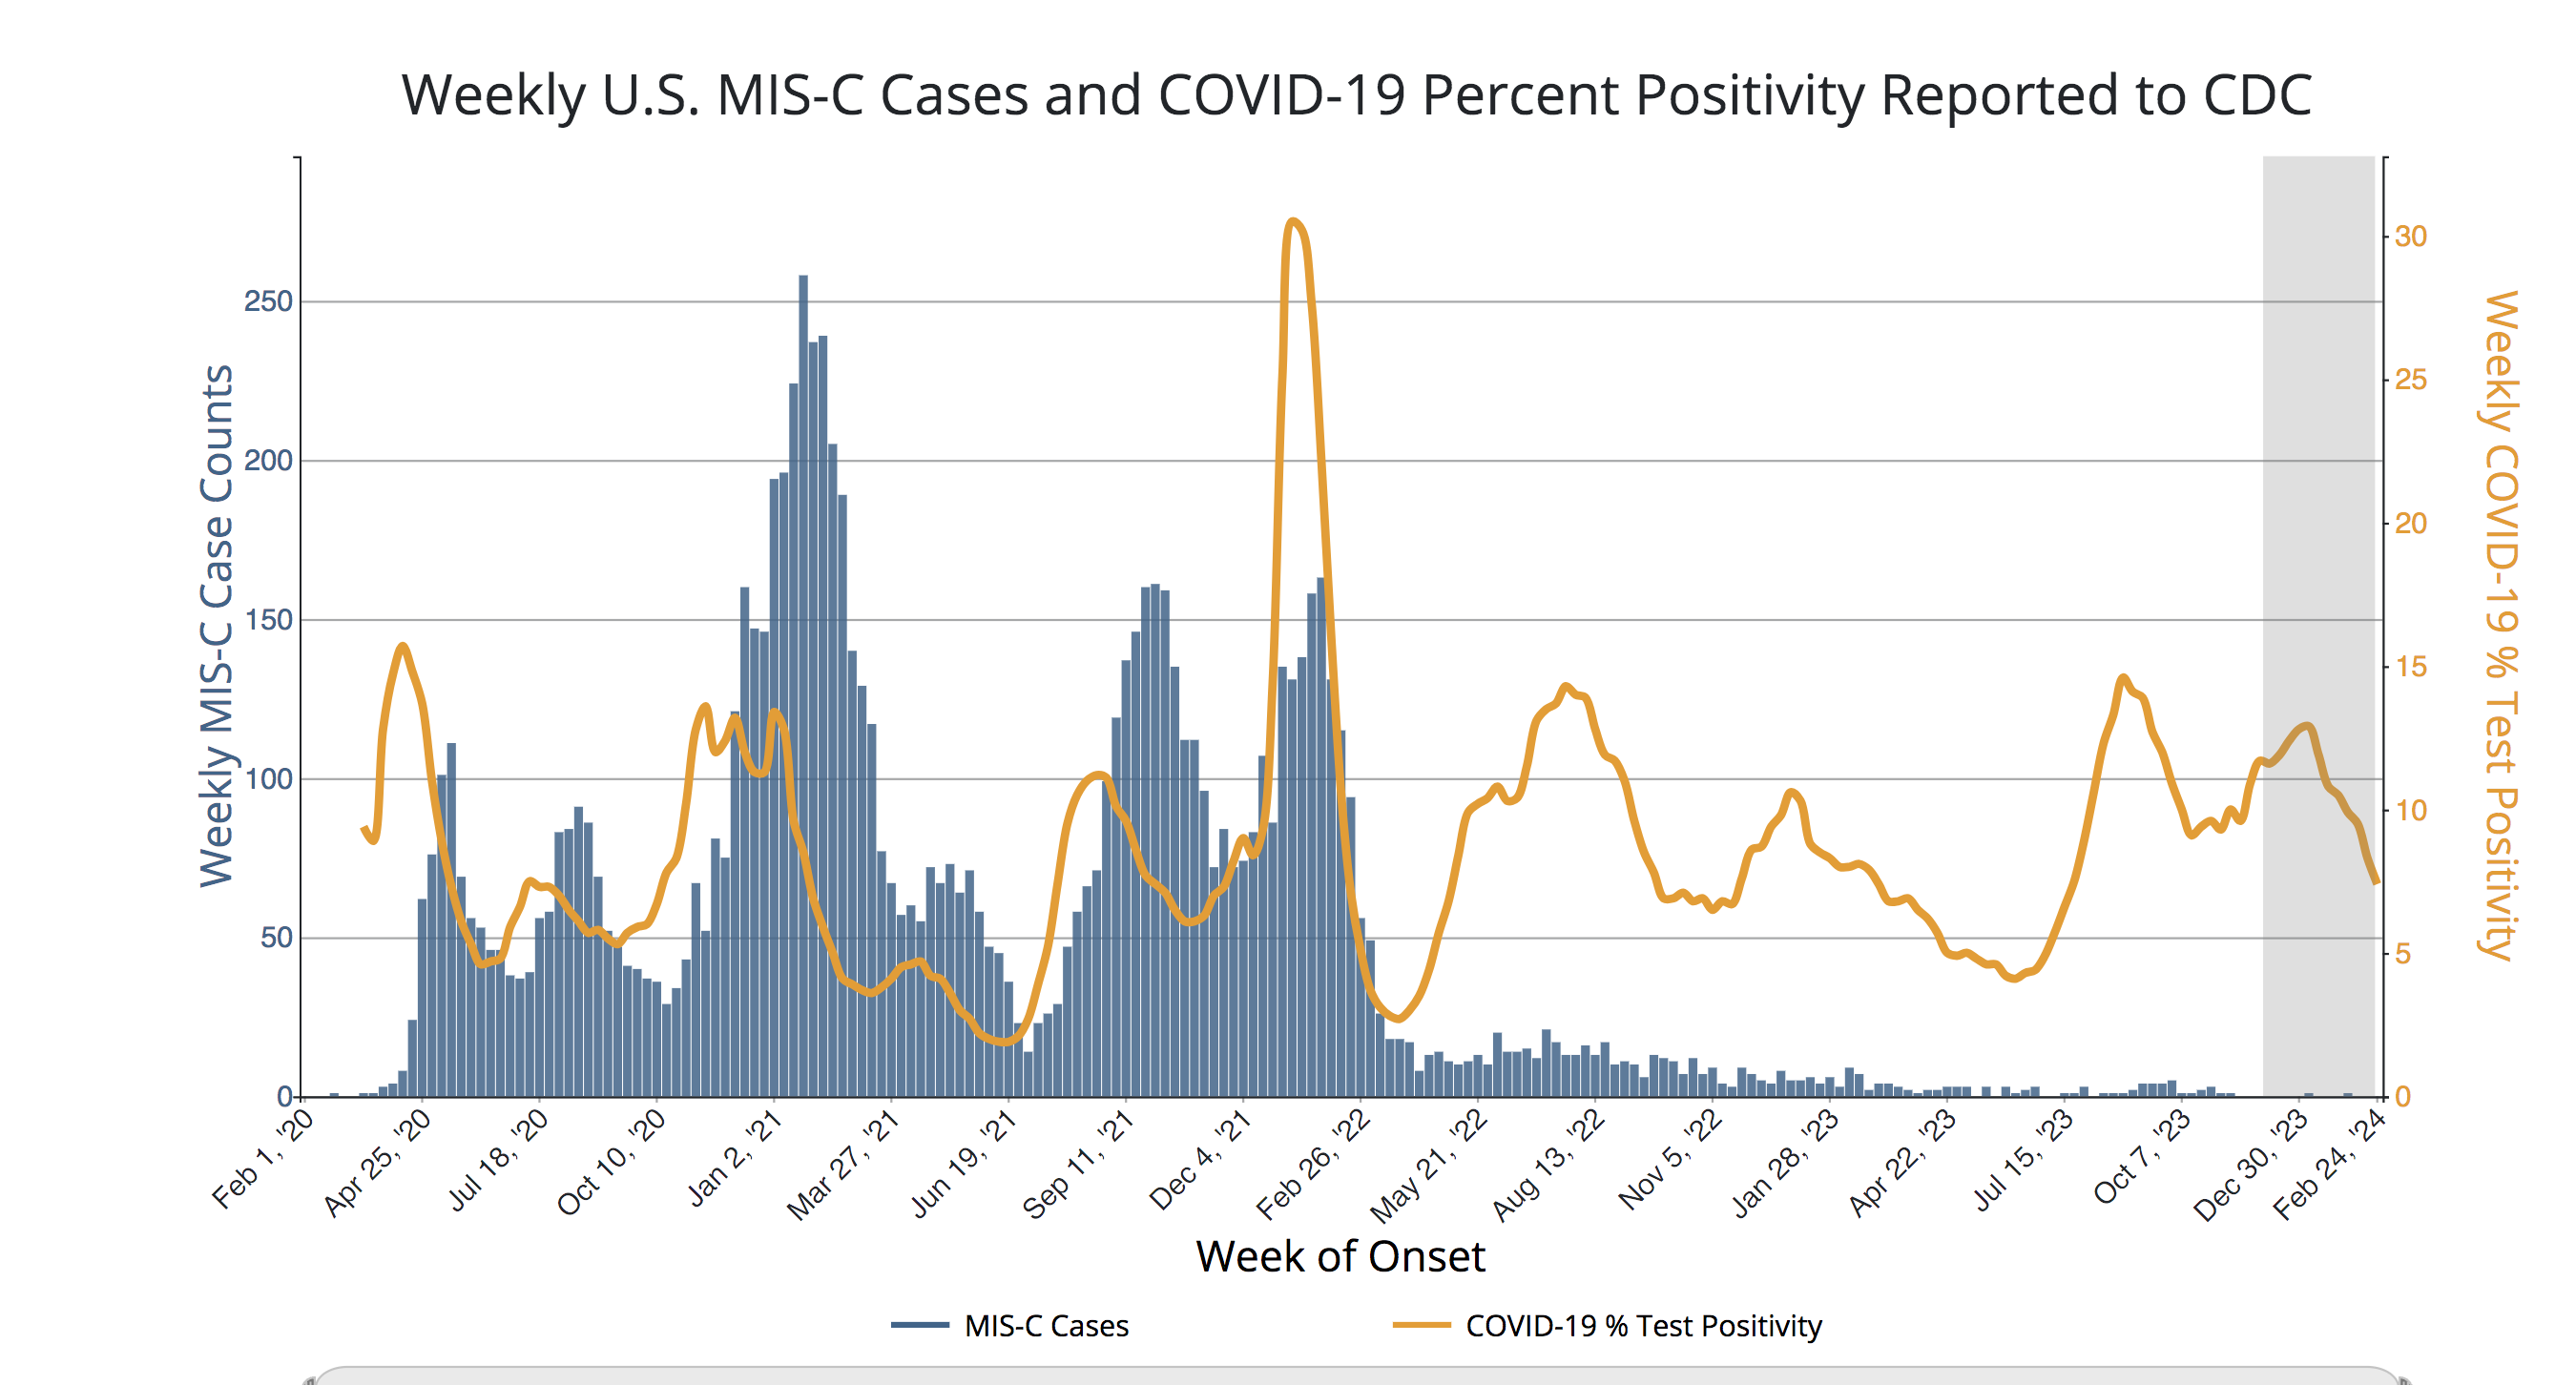
You can see by the chart that after May 21, 2022, the cases of MIS-C were way down relative to COVID cases.
But the vaccine rolled out for 7-year-olds (the most vulnerable group for MIS-C in 2023 according to the CDC report) in May 2021, one year earlier.
So did the vaccine magically suddenly start working 1 year later?
Nope. The CDC paper says the protective effect of the vaccine wears off after a year.
The data shows that immunity started to rapidly happen starting March 1, 2022 when the orange curve started to break away from the blue bars in the plot above.
It would be a mistake to credit the COVID vaccines with the drop in MIS-C cases. The drop in cases corresponds to the shift of the virus to the BA.2 variants.
If it was the vaccine, the protective effect would be weaker over time, not suddenly grow stronger over 1 year later.
Let’s give credit where it is due: to the virus, not the vaccine.
Amazing how the CDC was unable to figure this out, isn’t it?
All right. So let’s break this chart down. On the left, you have “Weekly MIS-C Case Counts.” On the right you have “weekly COVID-19% test positivity.”
There is a sharp fall in MIS-C Cases in Spring 2022.
See the same sharp fall in COVID vaccine doses administered in Spring 2022? Can you see the same spikes in COVID vaccine doses administered in early and late 2021? They aren’t perfectly correlated with the MIS-C cases above, but it’s a fairly strong correlation.
Continuing. Please note the difference between a “quantity” and a “rate.” The “orange curve started to break away” is not a quantity, it is a rate. Meaningless PCR tests (percentage) stayed in a range. Quantity of MIS-C is in blue, COVID rate is in orange.
You can see by the chart that after May 21, 2022, the cases of MIS-C were way down relative to COVID cases.
FACT CHECK: FALSE.
While the fake COVID-19 percentage stayed in a range, quantity of fake COVID-19 cases fell as cases of MIS-C fell. The graph Kirsch referenced did not even show “COVID cases.” CDC: “The graph shows the weekly MIS-C cases and COVID-19 Nucleic Acid Amplification Test (NAAT) percent positivity with date of onset between February 19, 2020 and January 28, 2024.”
I don’t see how he could miss that.
So again, why is Kirsch breaking away from his truthful rhetoric that vaccines cause Adverse Events like Multisystem Inflammatory Syndrome? The converse must also be true. Is it really this important to create Fake Virus rhetoric? (That’s a rhetorical question).
The CDC saw a relative increase in MIS-C cases in the fall of 2023, when the United States was experiencing a rise in COVID activity in the general population. Of 117 MIS-C cases reported in 2023, half involved intensive care unit (ICU) care. Of 112 kids with MIS-C who were eligible for immunization with COVID vaccine, 92 (82%) were unvaccinated
RELATIVE. Relative to what, the summer of 2023? I mean look at the damn chart. I highlighted the “Fall of 2023.”
“Not too many people could look at the data as he did here and reach such stupid conclusions. It takes work and thought.” 😂 And here I thought he was supposed to be this great data parser. First Conspiracy Sarah, and now you, out data parsing the data parser. Love it!


Again, "Syndrome" just means that they make shit up and lump collections of symptoms into a newly constructed entity, that is called a "syndrome".
Now it can become a novel entity and can be coded however needed to create fear or countermeasures because we are ruled by Scorpions and Rodeo Clowns.
“Not too many people could look at the data as he did here and reach such stupid conclusions. It takes work and thought.” 😂 And here I thought he was supposed to be this great data parser. First Conspiracy Sarah, and now you, out data parsing the data parser. Love it!